The Key HR Metrics during the Pandemic
- Marshall Valencia
- Aug 3, 2021
- 4 min read
Updated: May 11, 2023
Part 2 of 2
By: Alain Garcia
Alain Garcia is PVP’s Program Manager for Organizational Development and is currently finishing her master’s degree in MS Psychology major in Industrial/Organizational Psychology at De La Salle University.
Last June, we released the state of the key HR metrics during the pandemic and looked at the data we have on engagement, job satisfaction, intention to stay, and eNPS. Now, what do we do with these numbers? For this article, we turn our focus on the science of predictive analytics and find out what employee experience factors influence them to increase and decrease. What can we do to improve our current state? What areas should we focus on? How do we make the Philippine workforce more engaged, more satisfied, be willing to stay and promote their companies to future employees. We want to emphasize that the data and results below are the drivers of the different metrics which are based on actual predictive data, and not just a hunch or a feeling.
Before we lay down the predictors for each metric, below is the range of impact and its interpretation. In this article, we are going to present to you only the moderate and high impact factors. We’ll only show the top ten (10) drivers per metric.

As shown in part 1 of this article, engagement is at 72 -- which means that it is a flag up area. By doing statistical analysis of the data, a lot of employee experience factors, as well as leadership factors, have appeared to be predictors of the engagement score. As seen in the image below, the factors are placed on the left side and its corresponding level of impact is written on the right side. As an example, it is read as when teamwork is high, the likelihood of employees being engaged increases by 4.91. When empowerment is high, the likelihood of employees being engaged increases by 4.46, and so on.


The image above shows us that to increase employee engagement, we should focus on the following employee experience and leadership factors: teamwork, empowerment, supervisor support, top management trust & confidence, voice, top management concern, work load, recognition, and work resources support. Additionally, the results also show that there are certain demographics which are more likely to become engaged: job level is utility/security, job level is mancom, job level is asst. professor, job level is middle manager, age is 56 and above (boomer), job level is field worker, and job level is associate non-exempt.

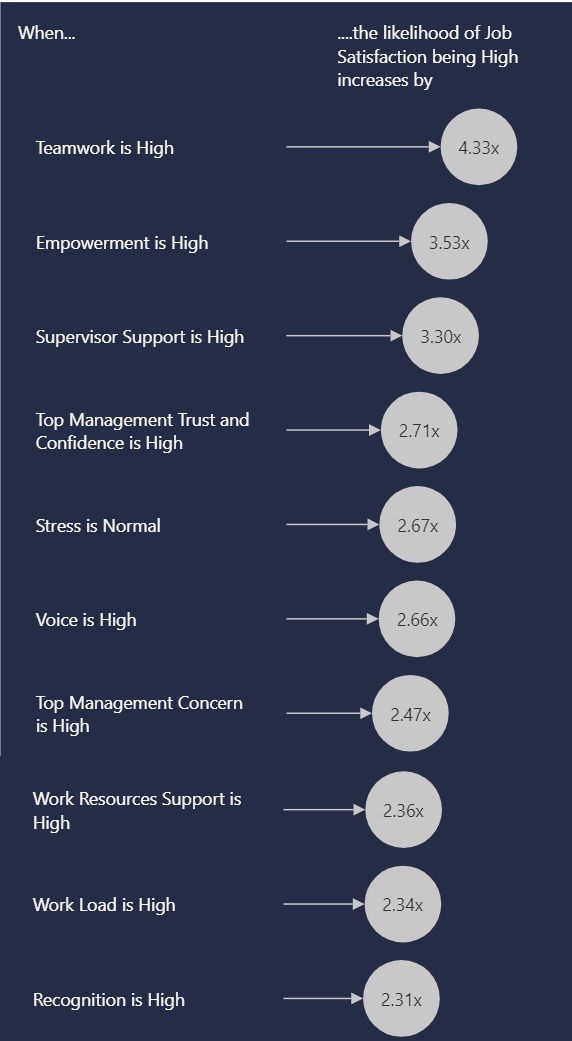
For job satisfaction, it was shown that the overall score is at 79 -- a strength area. For employees’ satisfaction with their jobs, it was found out that employee experience and leadership factors such as teamwork, empowerment, supervisor support, top management trust & confidence, voice, top management concern, work resources support, workload, and recognition are shown to be predictors of the said metric. To increase job satisfaction, focus on improving the above-mentioned factors.


What will make employees stay in the company? Just a refresher, the overall score of intention to stay is 37 -- a critical area. The image below shows us the different factors and its impact that would make employees stay in the company. Specifically, factors such as career development, training, teamwork, top management trust & confidence, top management concern, supervisor support, employee support, voice, and work resources support should be given attention so that employees will stay in the company. Moreover, it was also found that the following demographics are more likely to stay in their respective companies: job level is top management, job level is associate non-exempt, age is 50 to 59 years, job level is VP, age is 40-49 years, job level is functional head/supervisor.


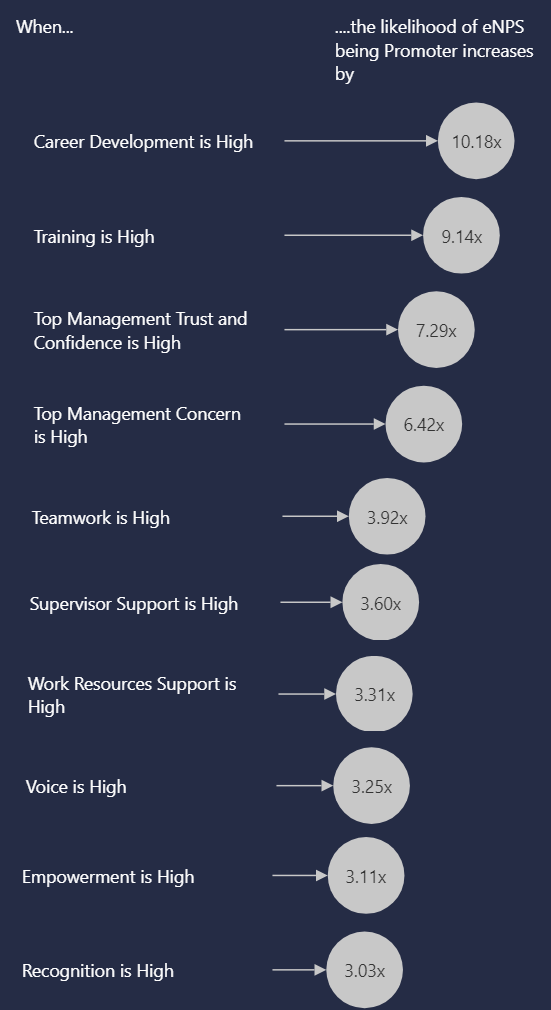
Finally, we have eNPS which is at 23. Given this, what can we do to increase our score and make employees promote their company as a place to work for? What are the factors to focus on so we sway and convert our passives to become promoters? Factors such as career development, training, top management trust and confidence, top management concern, teamwork, supervisor support, work resources support, voice, empowerment, and recognition would help increase the likelihood of employees becoming promoters of the company. Additionally, demographics like age is 50 to 59 years, job level is VP, job level is top management, age is 40 to 49 years, job level is utility/security, age is 31 to 35 years are more likely to recommend their company to others.


Given all this information, we can turn our focus on specific factors for addressing our key HR metrics and not just guess the areas to work on. Or even more unmanageable, working on all the employee experience factors at once. Focus on the factors where we scored low and have a high impact on our metrics, and especially those factors who influence several key HR metrics. Once we have finalized the factors to start working on, we can now plan and implement the activities, programs and interventions to improve our key HR metrics. Time is a scarce resource. If we put company time and effort into improving all employee factors then we become counter productive when some of them don’t lead to improving our key HR metrics.
The data from our study may not apply to your company. If you want to have the same analysis for your company, let PVP help you. Email us at info@pvpi.ph or visit https://www.pvpi.co/hrmetre
Comments